Building a Clinical Data Pipeline with MIMIC-IV
A comprehensive, production-oriented clinical data pipeline that mirrors real-world practices in pharma and biotech—featuring scalable ingestion, robust transformation, feature engineering, machine learning, and interactive delivery using modern data science tooling.
The Dataset: MIMIC-IV
This project centers on the MIMIC-IV dataset — a de-identified critical care database from the MIT Lab for Computational Physiology. MIMIC-IV is widely used in health outcomes research and AI model development in healthcare, offering rich, timestamped clinical data essential for understanding patient journeys and system-level patterns.
These high-resolution, longitudinal data streams support advanced analytics, such as real-world evidence (RWE) analysis, patient stratification, and predictive modeling—key areas of interest in biopharma and clinical informatics.
Stage 1: Setting Up the Analytical Environment
Tools used: Linux shell, Git, Quarto
This stage focused on environment setup and version control. I used the Linux shell to navigate directories, execute scripts, and manage file systems efficiently. Git was used to maintain clean version history, enabling reproducibility and collaboration. I also established a basic Quarto framework for documentation.
Skills gained: Strong command-line fluency, version control best practices, and documentation-first workflows—foundational skills for reproducibility and audit-readiness in regulated analytics environments.
Stage 2: Ingesting and Exploring MIMIC-IV
Goal: Develop a scalable ingestion pipeline for MIMIC-IV datasets, focusing on labevents and chartevents.
Tools used: R (readr, dplyr, arrow), DuckDB, Linux shell
I used R to load and inspect raw clinical tables, and DuckDB with dbplyr to run SQL queries and convert large CSVs to compressed Parquet files. This allowed efficient, in-memory querying without needing a full database setup.
Skills gained: High-volume data ingestion and profiling, experience with columnar formats like Parquet, efficient analytics over large files using SQL-in-R tools, and scripting automation—aligned with modern cloud-first data workflows in biotech.
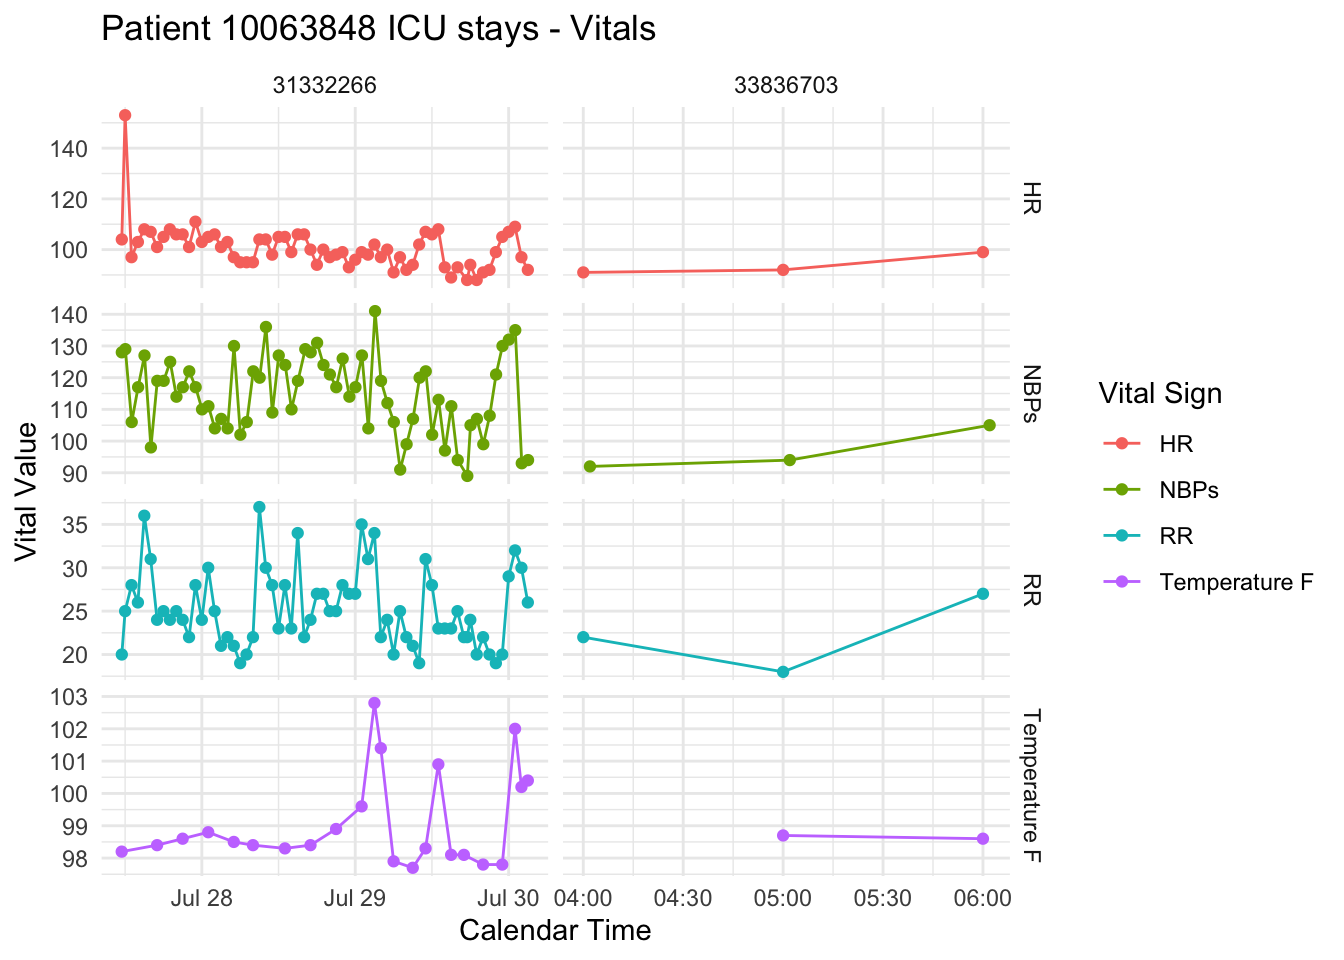
Stage 3: Feature Engineering and Visualization
Goal: Create meaningful features from raw data for downstream modeling and interpretability.
Methods:
- Extracted features such as summary statistics of vital signs and lab measurements over time windows.
- Visualized patient subgroups using R’s
ggplot2andplotly.
Skills gained: Clinical feature engineering, longitudinal data summarization, and insightful exploratory analysis—critical for model development, cohort definition, and hypothesis-driven RWE studies.
Stage 4: Scalable Feature Engineering with BigQuery + RShiny Dashboard
Goal: Build a cloud-based pipeline to extract ICU features from MIMIC-IV and deliver an interactive dashboard for data exploration.
Tools used: Google BigQuery, SQL, R, RShiny
This stage involved transitioning to a cloud-native architecture using Google BigQuery for efficient data transformation and feature curation. I designed modular SQL queries to:
- Join and filter MIMIC-IV tables (
admissions,icu_stays,chartevents,labevents) - Extract first-hour ICU vitals and most recent pre-ICU lab results
- Build a cleaned cohort ready for machine learning in downstream stages
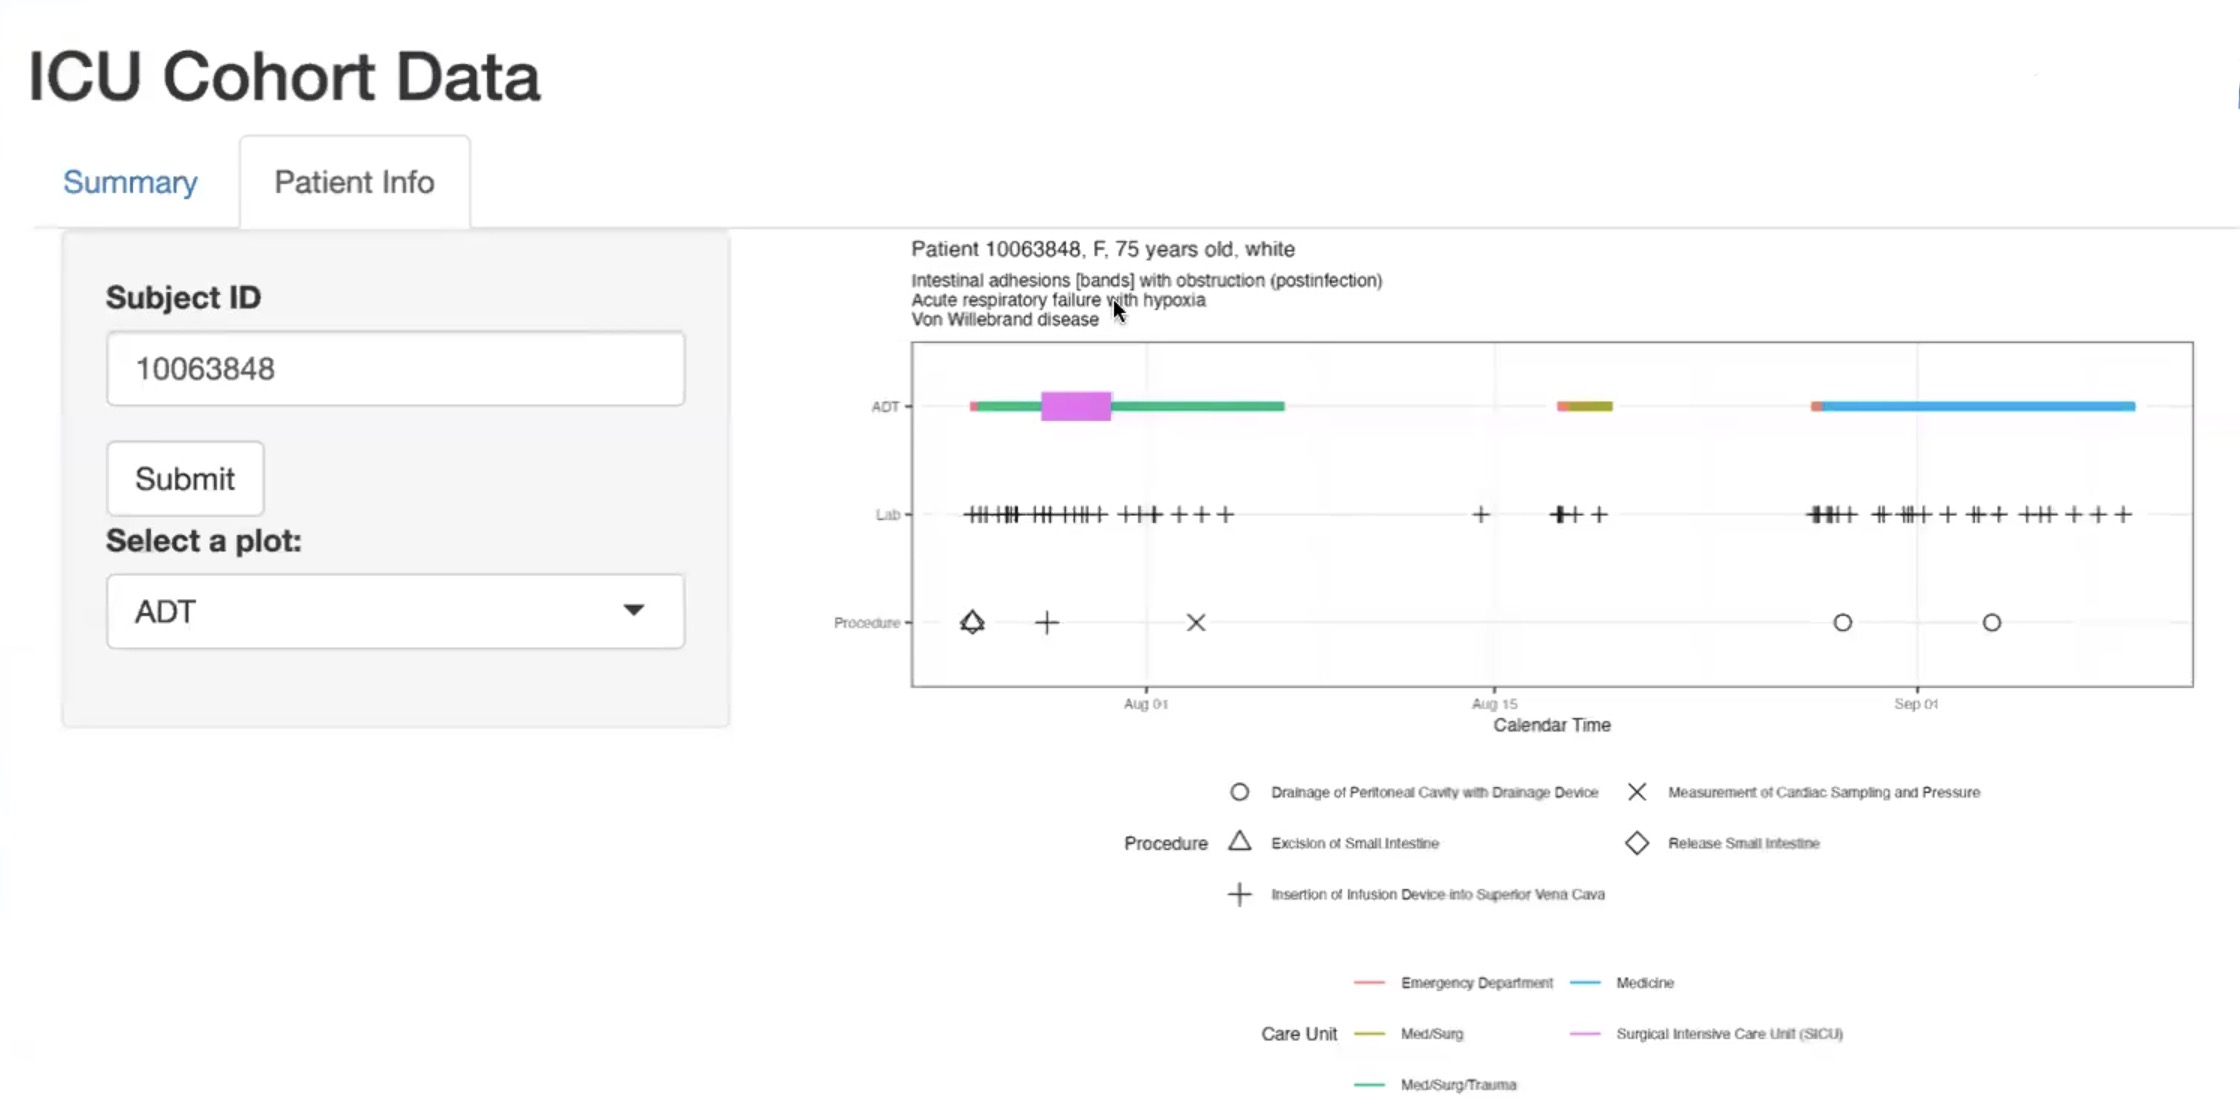
In parallel, I developed an interactive RShiny dashboard that enables non-technical stakeholders to explore patient-level trajectories and summary statistics. This tool connected insights from previous visualizations to an intuitive UI.
Skills gained: Cloud-based SQL for health data engineering, reproducible query design in BigQuery, and development of interactive applications using RShiny for real-world health analytics use cases.
Stage 5: Predicting ICU Length of Stay
Goal: Predict whether an ICU patient’s stay would exceed two days using demographic and admission information available at the start of their ICU encounter.
Approach:
Using the cohort prepared in Stage 4, I developed multiple classification models to predict the binary target variable los_long. Models included:
- Logistic Regression with Elastic Net regularization
- Random Forest
- XGBoost
- Support Vector Machine (SVM)
- A stacked ensemble model integrating predictions from all of the above
Features used:
- Demographics (gender, age, race, marital status)
- ICU admission information (first care unit)
- First vital signs during ICU stay
- Last recorded lab values prior to ICU admission
Skills gained: Applied multiple supervised learning algorithms and stacking strategies, handled appropriate feature selection based on data availability at ICU admission, and refined classification workflows for real-world predictive tasks in healthcare analytics.
Why This Project Matters
This portfolio project replicates end-to-end workflows found in pharma, biotech, and clinical research analytics teams:
- Translating raw, high-volume EHR data into analytic cohorts using reproducible pipelines
- Feature engineering under temporal and causal constraints—mirroring real-world regulatory considerations
- Applying and comparing machine learning models for risk stratification and resource forecasting
- Delivering insights through code-backed dashboards and Quarto-based documentation for clear stakeholder communication
In sum, this project demonstrates my ability to think critically about data provenance, use modern open-source tooling, and communicate results effectively—core competencies for roles in real-world evidence generation, data science in drug development, and health data analytics.